
Solutions for Our Climate (SFOC) is a non-profit organisation dedicated to mitigating the social and environmental impacts of climate change. The organisation engages in research, litigation and community organizing to identify strategies for reducing greenhouse gas emissions and increasing renewable energy use. SFOC had begun assessing the environmental impact of liquefied natural gas (LNG) carriers, specifically calculating the direct and indirect greenhouse gas (GHG) emissions these ships produce over their typical lifespan.
The methodology of this study is based on the National Resources Defence Council’s 2020 report, “Sailing to Nowhere” (Swanson et al., 2020) which compiles the key stages of the LNG life cycle based on five reports published between 2014 and 2019. SFOC has engaged with an external consultant, Zevero, to assess the suitability of the NRDC report for communicating the environmental impact of LNG carriers in 2024. Zevero provides SFOC with a detailed assessment of the emissions analysis and additions based on two additional papers, “2nd Life Cycle GHG Emission Study on the Use of LNG as Marine Fuel Final Report” by Sphera in 2021 (Schuller et al., 2021)and the peer-reviewed study “The Greenhouse Gas Footprint of Liquefied Natural Gas (LNG) Exported from the United States” by Robert Howarth in 2024(Howarth, 2024).
Zevero has also deployed a harmonisation methodology based on input from the NRDC and confidential data from SFOC’s shipping partners. This methodology considers several harmonisation factors from the 2014 paper “Harmonization of initial estimates of shale gas life cycle greenhouse gas emissions for electric power generation” from Heath et al. (Heath et al., 2014). In addition, the downstream uses of LNG globally have been compiled into an index to easily swap out a general combustion emission factor in lieu of electricity generation, which is the predominant use of exported LNG.
Methodology
Our methodology is best described as additional review to the NRDC paper, which harmonised four different LNG LCA studies. We choose to reference the internationally recognised LCA standards, ISO 14040 and 14044 to guide the reporting of our efforts. Additionally, we also referred to the ISO 14083 standard to help us with quantifying and reporting of greenhouse gas emissions from transport chain operations. Here, we note we were not able to obtain the harmonisation methodology for NRDC’s original 2020 paper. We have instead opted to keep the harmonisation and standardisation of the life cycle stages intact and implicitly explore the reviewed papers for harmonisation factors to incorporate the additional Sphera and Howarth studies.
Goal and Scope Definition
This document aims to quantify the greenhouse emissions of the life cycle of LNG from upstream processes to the power plant operations and final electricity generated from exported LNG through the review and standardisation of six LNG LCA studies spanning from 2014-2024. The audience for our report would be policy makers, financiers and stakeholders who would like to determine the direct and indirect emissions of transporting LNG to global consumers.
The functional unit of this system is g CO2-equivalent/kWh of electricity. The boundary of our system carries over from the NRDC report where mainly the five stages of LNG life cycle (including electricity power plant operation) are considered. Using harmonisation factors put forth in the Heath et al paper, we have also considered the boundaries to not include the power plant upstream or downstream emissions (a difference from the Heath et al paper), but similarly to remove electricity transmission and distribution losses.
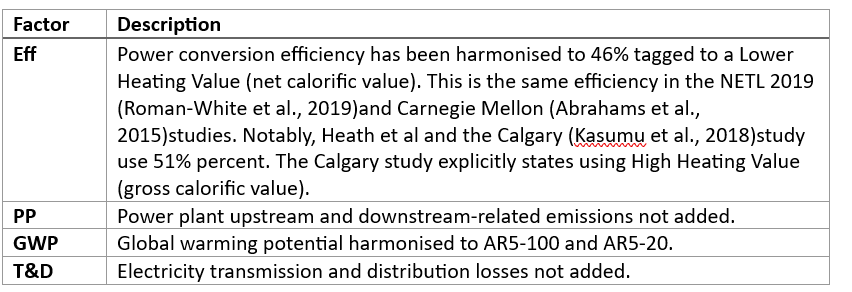
We may not recommend this study for public comparative assertions until a peer-review or third-party audit has been done of this report. Nevertheless, we aim to be transparent about our harmonisation methodology and are providing a description of the harmonisation factors that were applied in Table 1.
Table 1: Harmonisation Factors and Description
Life Cycle Inventory
We intend to retain the emissions analysis in the NRDC "Sailing to Nowhere" report. The report breaks down the LNG lifecycle into five key stages, quantifying the greenhouse gas (GHG) emissions at each stage:
Upstream Emissions
Extraction, Processing, and Pipeline Transport: This stage includes the emissions associated with extracting natural gas, processing it, and transporting it via pipelines to liquefaction facilities.
- "Emissions during the upstream stage make up 29 to 52 percent of the total emissions in the short term, but only 16 to 34 percent in the long term." NRDC
Methane Leaks: Methane, a potent greenhouse gas, is a significant contributor during this stage.
Collected dataRetain emission factors from published NRDC report, add the Sphera “Gas production, processing, and pipeline transport” emission factor, and globally weight the Howarth emission factor “Upstream & midstream emissions” using the May 2024 LNG carrier fleet book provided by SFOC’s industry partner.
The NETL (both 2014 and 2019) and Carnegie Mellon studies are mainly those of upstream LNG plays in the United States. This is the case with the Howarth 2024 paper as well.
The Calgary paper compiles upstream emissions from various North American studies, and the Sphera paper also provides North American specific emission factors.
Additionally, the Sphera paper also models global mix of LNG, therefore some exposure to global LNG extractions is present. The global aggregation present in the Sphera paper does not suggest this is a true global mix for 2024.
Liquefaction
This process involves cooling natural gas to -162°C to convert it into liquid form, which is energy-intensive and results in CO2 emissions.
- "Gas is cooled to -162 degrees Celsius to reduce its volume and convert it to liquid form; occurs in the exporting country; greenhouse gas emitted: almost all carbon dioxide." NRDC
Contribution to Total Emissions: Liquefaction contributes significantly to the lifecycle emissions.
- "Emissions attributable to overseas export of gas (the liquefaction, tanker transport and regasification life stages) make up the final 8 to 21 percent for the 20-year time frame and 10 to 21 percent for the 100-year time frame." NRDC
Collected dataRetain emission factors from published NRDC report, add the Sphera “Gas liquefaction (incl. purification)” emission factor, and globally weight the Howarth emission factor “Liquefaction” using the May 2024 LNG carrier fleet book provided by SFOC’s industry partner.
The NETL (both 2014 and 2019) and Carnegie Mellon studies are mainly those of liquefaction facilities in the United States. This is the case with the Howarth 2024 paper as well.
The Calgary paper compiles emissions from various North American studies, and the Sphera paper also provides North American specific emission factors.
Additionally, the Sphera paper also models a global mix of LNG, therefore some exposure to global liquefaction emissions is present. The global aggregation of the Sphera paper does not suggest this is a true global mix for 2024.
Tanker Transport
Transporting LNG via tankers involves burning fuel, leading to CO2 emissions, and potential methane slip.
- "Liquefied natural gas is loaded onto an LNG tanker and transported to its destination port; occurs on the high seas; greenhouse gas emitted: mostly carbon dioxide." NRDC
Collected data
Retain emission factors from published NRDC report, add the Sphera “LNG carrier transport” emission factor, and globally weight the Howarth emission factor “Emissions from tanker” using the May 2024 LNG carrier fleet book provided by SFOC’s industry partner.
The NETL (both 2014 and 2019) are mainly those of transportation from the U.S. to Europe and Asia with only singular cities being the hubs to the regions. The Carnegie Mellon paper looks at several cities in Asia Pacific, South Asia, the United Kingdom, and the Netherlands. The Howarth paper looks at world average voyages from the United States.
The Calgary paper compiles transport emissions from British Columbia, Canada. The Sphera paper provides aggregated North American specific emission factors.
Additionally, the Sphera paper also models a global mix of LNG, therefore some exposure to other voyages other than the United States to other consumption regions is present. The global aggregation of the Sphera paper does not suggest this is a true global mix for 2024.
Regasification
This stage involves warming LNG to convert it back into gas form, which also requires energy and results in emissions.
- "Liquefied natural gas is re-warmed to convert it to a gas; occurs in the importing country; greenhouse gas emitted: mostly methane." NRDC
Collected dataRetain emission factors from published NRDC report, add the Sphera “LNG terminal operations and maritime bunkering” emission factor, and globally weight the Howarth emission factor “Final transmission and distribution” using the May 2024 LNG carrier fleet book provided by SFOC’s industry partner.
The Sphera paper labels this as “terminal operations and maritime bunkering” though does not separate the any maritime uses of electricity in this process. All electricity and methane slip are assumed to be part of the bunkering process. No further LNG is consumed as the reference unit of the Sphera study is LNG in tank. Regasification is assumed not to occur as the LNG goes directly to bunker in another vessel.
Power Plant Operations
The final stage where LNG is burned to generate electricity, producing CO2 emissions.
- "Gas is burned in a power plant to generate electricity; occurs in the importing country; greenhouse gas emitted: almost all carbon dioxide." NRDC
Collected dataRetain emission factors from published NRDC report, add an estimate for the global electricity consumption based on the Calgary paper which compiled power plant operations (PPO) adjusted for varying natural gas plant efficiencies for 12 countries excluding the United States. This was appended to the Global and North American mix of the Sphera paper. Note that regasification is not included in the Sphera results. As a result, a minor amount of emissions are missing when adapting PPO to the Sphera study, which primarily focused on LNG bunkering.
The Howarth paper uses a stoichiometrically derived emission factor based on the composition of carbon dioxide and methane in natural gas.
Life Cycle Impact Assessment
The six LNG LCA studies were all assessed for climate impacts measured in grams carbon dioxide-equivalent (g CO2e). The global warming potential has been standardised at the 100-year and 20-year time frames. While the 100-year GWP100 metric is commonly used in lifecycle assessments and greenhouse gas inventories, it underestimates methane’s impact on global warming over the next few decades. Many researchers advocate for using the 20-year GWP20 metric to better capture methane’s significant short-term warming effects, emphasizing the urgency of reducing methane emissions to meet climate targets. As noted in the studies, AR5 (released 2013-2014) is predominately used. AR4 (released 2007) is also included in the results and sensitivity analysis for the NETL 2014 paper, likely because during its publication, AR5 has not been widely adopted. None of the papers used AR6 (released 2021-2022) emission factors. AR5 was used in our harmonisation. Table 2 presents the emissions from each study as was harmonised by NRDC and for the final two papers harmonised by SFOC.
The studies mainly consider carbon dioxide (CO2) and methane (CH4) as the major emission types from the LNG life cycle. The Sphera paper notes that nitrous oxide (N2O) contributes to a very small extent (<0.5%) to the total GHG emissions of the global LNG supply chain, primarily from combustion processes within the LNG life cycle. NETL 2014 and Carnegie Mellon 2015 also directly address N2O emissions, and Howarth mentions that other greenhouse gases such as nitrous oxide are very minor contributors to the total emissions for natural gas and LNG systems. In our research, we focused on carbon dioxide (CO2) and methane (CH4) emissions, which are the major greenhouse gas contributors in the LNG life cycle. While nitrous oxide (N2O) was not included in our review, we acknowledge that it potentially has significance due to its high global warming potential of 273 over a 100-year time frame (based on AR6).
Table 2: Greenhouse Gas Emissions for each Life cycle stage of Liquefied Natural Gas (LNG) Exports

Interpretation
The findings of the harmonisation of the Sphera and Howarth studies to the NRDC are shown in Table 2. The largest anomalies in the presented emissions are in the Upstream emissions of both the newly included studies. The Sphera studies seem to quantify Upstream emissions approximately 2-3x less than the previously included studies and the Howarth paper shows Upstream emissions approximately 2-3x more than the previously included studies.
The Sphera paper shows that in the Natural Gas production and processing stage, most of the energy usage comes from Natural Gas itself for many countries. Crude oil is not applicable for any company except Algeria. We acknowledge that the data source for these countries comes from Exxon Mobil for United States conventional gas production and processing and gaps were filled by using Sphera’s GaBI LCI databases.
Howarth has identified his estimates are higher for upstream and midstream emissions compared to previous assessments due to three critical factors. Firstly, previous assessments often do not include the indirect emissions of carbon dioxide associated with developing, processing, and transporting the natural gas used to produce LNG. Additionally, they exclude the upstream and midstream methane emissions associated with the natural gas that powers the liquefaction process and fuels tankers, focusing only on emissions from the LNG consumed by the final customer. Furthermore, the emission factor for upstream and midstream methane emissions used in prior analyses is lower than the value used in Howarth’s analysis. Howarth’s study references the most recent literature, namely a study using aircraft flyover or aerial measurements of upstream and midstream of the LNG value chain emissions from Sherwin et al. (2024) as the basis for these higher numbers.
Scenario Analysis
With the audience for this report being LNG carrier owners and stakeholders, we would like to present two scenarios that portray the life spans of different capacity LNG carriers.
Scenario 1 has the following profile:
175,000 cbm capacity LNG carrier
2.1 million cbm with an assumed 12 voyages per year calculates to 945,000 tonnes LNG transported yearly
Under a life span of 30 years, the greenhouse gas emissions from this carrier under the AR5 20-yr GWP is approx. 369.88 mt CO2e
This carrier enables 12,329,499 tCO2e/year from transporting LNG to be converted to electricity.
Citations
Abrahams, L. S., Samaras, C., Griffin, W. M., & Matthews, H. S. (2015). Life cycle greenhouse gas emissions from U.S. liquefied natural gas exports: Implications for end uses. Environmental Science and Technology, 49(5), 3237–3245. https://doi.org/10.1021/es505617p
Comer, B., Beecken, J., Vermeulen, R., Sturrup, E., Paschinger, P., Osipova, L., Gore, K., Delahaye, A., Verhagen, V., Knudsen, B., Knudsen, J., Verbeek, R., & 2024, J. (2024). Fugtive and Unburned Emissions from Ships (FUMES) Characterizing methane emissions from LNG-fueled ships using drones, helicopters, and onboard measurements. www.theicct.org
Heath, G. A., O’Donoughue, P., Arent, D. J., & Bazilian, M. (2014). Harmonization of initial estimates of shale gas life cycle greenhouse gas emissions for electric power generation. Proceedings of the National Academy of Sciences of the United States of America, 111(31). https://doi.org/10.1073/pnas.1309334111
Howarth, R. W. (2024). The Greenhouse Gas Footprint of Liquefied Natural Gas (LNG) Exported from the United States
https://www.research.howarthlab.org/publications/Howarth_LNG_assessment_preprint_archived_2023-1103.pdf
Kasumu, A. S., Li, V., Coleman, J. W., Liendo, J., & Jordaan, S. M. (2018). Country-Level Life Cycle Assessment of Greenhouse Gas Emissions from Liquefied Natural Gas Trade for Electricity Generation. Environmental Science and Technology, 52(4), 1735–1746. https://doi.org/10.1021/acs.est.7b05298
Roman-White, S., Rai, S., Littlefield, J., Cooney, G., & Skone, T. J. (2019). Life Cycle Greenhouse Gas Perspective on Exporting Liquefied Natural Gas from the United States: 2019 Update.
Schuller, O., Kupferschmid, S., Hengstler, J., & Whitehouse, S. (2021). 2nd Life Cycle GHG Emission Study on the Use of LNG as Marine Fuel.
Swanson, C., Levin, A., Stevenson, A., Mall, A., & Spencer, T. (2020). Sailing to Nowhere: Liquefied Natural Gas is Not an Effective Climate Strategy. www.suerossi.com
Thepsithar, P., Koh, E. K., Piga, B., Xiao, Z., Sze, J. Y., Liu, M., Peng, L., Gou, X., Milla, K. P. R., & Lam, S. L. J. (2020). Alternative Fuels for International Shipping With inputs from Maritime and Port Authority of Singapore Content.
Related insights

World Environment Day, June 5
#BeatPlasticPollution: A Climate Imperative
2025-06-05

Financing the Climate Crisis: South Korea’s Global Fossil Fuel Footprint
The Role of Public Financing Institutions in the Age of Climate Change
2025-06-04

Navigating the Blue Future: SFOC at the 2025 Our Ocean Conference
Busan, Korea (April 28 - 30, 2025)
2025-05-08

IMO Approves First-Ever Global Carbon Pricing for Shipping — But Is It Enough?
MEPC 83 Marks a New Era in Shipping Decarbonization, Yet Falls Short in Ambition
2025-04-25

Retracing the Steps of the LNG Trade: Why Canada's First Nations Came to Korea
The LNG Boom is "Good News"...for Whom?
2025-03-13

COP29 Sees Global Methane Standards Tighten
What’s next for South Korea’s public energy companies?
2024-11-16

International Shipping Industry’s Passage to Net-Zero by 2050
What really happened at the MEPC 82?
2024-10-11

True Climate Impact of LNG Carriers
A comprehensive lifecycle emission analysis of LNG, enabled by LNG carriers
2024-10-11

Floating Pipelines Fuelling the Fossil Fuel Crisis: LNG Carriers
2024-09-01


